The blue arrow button, “AutoShift charts”, enables or disables automatic chart shifting. When the button is ON, the chart is locked to the right edge, and new trades appear on the right, starting from the level of an imaginary vertical line. In this mode, horizontal manual scrolling is not possible.
If you need to shift the chart to the left — for example, to use the Pencil-Emulator, extend a trend line, or define a potential entry point during price movement — disable the “AutoShift charts” button. Then, hold the left mouse button and drag the chart in the desired direction. If the chart is not moved manually, the price will continue to shift to the right over time and may move beyond the visible chart area.
Additionally, if you first disable this button and then enable it again, all charts in Moonbot will automatically recenter vertically.
You can also scroll the chart manually left and right by holding the left mouse button, or by holding Shift or Alt while using the mouse scroll wheel. This allows you to review trade history. Recent trades are shown as crosses, while trades from a few hours ago are automatically converted into mini-candles for performance optimization and to extend chart history length.
If you’ve moved the chart far into the past and want to quickly return to the current time, use the Center Chart hotkey (default: Ctrl + Right Arrow), which can be configured under Settings → Hotkeys.
On the chart, the mouse cursor appears as crosshair lines. At the bottom of the vertical line, the date and time are shown, to the left of the horizontal line — the horizontal volume and coin price, to the right of the horizontal line — the volume of limit orders in the Order Book and the percentage distance to the average price line.
Coin search field
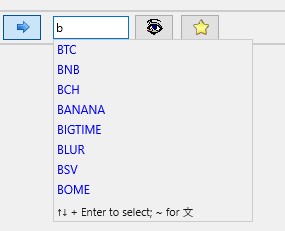
Next is the coin search field, where you can enter coin names; if a match is found, the chart for that coin will open immediately in the Moonbot terminal. You can enter the coin name using lowercase or uppercase letters, or numbers.
When you enter one or more letters or numbers, if the coin name is unique, its chart will open immediately in the terminal.
If there are several coins with a matching combination of letters, a menu listing these coins will appear below.
You can then:
- either left-click on the name of the desired coin in the menu
- or use the up and down arrows to navigate the menu and press Enter to select the coin’s name
- or continue typing the coin’s name until a unique match is found.
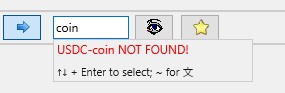
If the coin is not available on this marketplace, the menu will display a red message stating: USDC-coin not found!
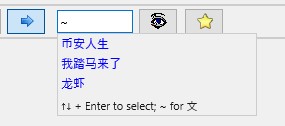
If you enter the sign "~" (tilde), the sign "+", the sign "`" (backquote) or the letter "Ё" (for Cyrillic keyboard layout) in the coin search field, all coins with Chinese names on the market to which the terminal is currently connected will be shown in the menu.
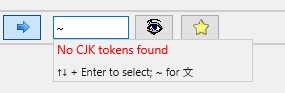
If there are no Chinese coins on this marketplace, the menu will display a red message stating: No CJK tokens found
If, for example, you want to open the chart for the 1000SHIB token, you don’t need to enter the full name – simply type "SHIB" and the chart for that token will open in the Moonbot terminal.
In addition, you can enter special commands in this field:
- to update test versions (InstallTestVersion Moonbot with the test version index) when the ‘Accept beta versions’ checkbox is ticked in the Settings → Advanced → System tab
- to update to the current release version (InstallTestVersion Release)
- to log more detailed data (LogEveryRequest) and other service commands.
Eye Icon (“Look for action”)
Next to the input field is the “Look for action” button (eye icon), which highlights the most volatile coins at the current moment based on Moonbot’s internal algorithm.
This same button is also available in the Menu → Pump Helper window.
Currently, this mode is rarely used, as traders more often sort coins by high delta in the MarketTable, or configure a series of detector strategies (Pump,Drops, Delta, MoonHook, MoonStrike, etc.,) which automatically track active movements based on configured conditions — price spikes, volume increases, surges, and other market events.
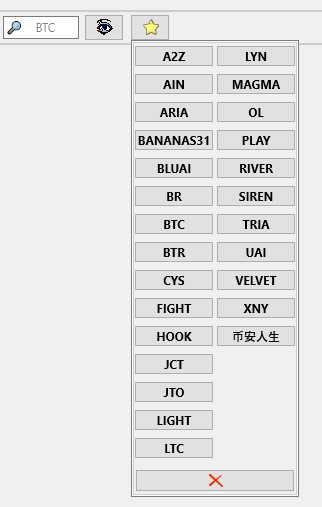
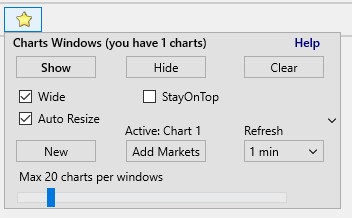
The next button, the "Yellow Star", serves two main functions: displaying favorite coins and monitoring charts in separate chart windows.
-
Displaying Favorite Coins
If you left-click on the yellow star, a list of your favourite coins will open.
You can add a coin to this list using the ‘Fav’ button (with a grey star), which is located below the ‘Order’ button. Once a coin has been added to your favourites, a yellow star will appear on the button.
Coins in the favourites list are grouped into columns of 15 names. If there are more than 15 coins, a second column is formed in the list for the next 15 coins.
This favourites list helps you quickly find the coins you’re interested in without having to search for them manually.
To open a coin’s chart from the favourites list, click on its name.
You can remove a coin from your favourites by left-clicking on it or by clicking the button with the yellow star again to turn it grey.
If you need to clear the entire list of favourite coins, click the button with the red cross.